Introduction to RF Explorer
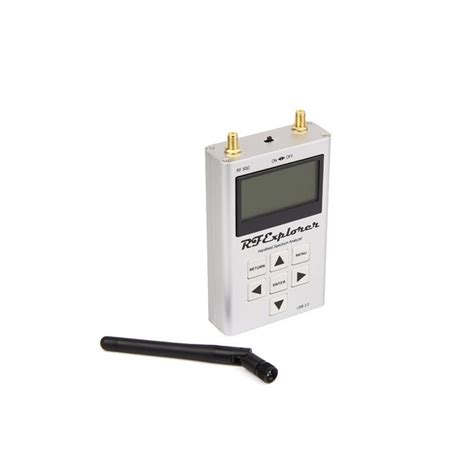
The RF Explorer is a handheld, portable spectrum analyzer that allows you to visualize and analyze radio frequency (RF) signals from 15 MHz up to 2.7 GHz. It is a versatile tool for hobbyists, engineers, and technicians who need to troubleshoot and optimize wireless systems.
Some key features of the RF Explorer include:
- Wide frequency range from 15 MHz to 2.7 GHz (depending on model)
- High dynamic range of over 70 dB
- Fast sweep speed of less than 200 ms
- Portable, handheld form factor with rechargeable battery
- PC connectivity via USB for data logging and remote control
The RF Explorer is available in several different models optimized for specific frequency ranges and applications:
| Model | Frequency Range | Key Applications |
|---|---|---|
| ISM Combo | 240 MHz – 960 MHz | ISM band analysis, ham radio, baby monitors, garage door openers |
| 3G Combo | 15 MHz – 2.7 GHz | Cellular, Wi-Fi, Bluetooth, cordless phones, walkie-talkies |
| WSUB1G | 240 MHz – 960 MHz | Sub-1 GHz ISM bands, ham radio, remote control |
| 6G Combo | 4.85 GHz – 6.1 GHz | 5 GHz Wi-Fi, Radar, scientific/medical |
With its wide frequency range, high performance, and affordable price, the RF Explorer has become a popular spectrum analyzer for many RF applications. Let’s take a closer look at how it works and how to use it effectively.
How RF Explorer Works
At its core, the RF Explorer is a simple spectrum analyzer. It works by sweeping across a range of frequencies and measuring the amplitude of any signals that are present at each frequency. This allows it to display a graph of signal strength vs. frequency, which is the basic spectrum display.
The RF Explorer uses a sensitive receiver to pick up even weak RF signals. The receiver frequency is controlled by a synthesizer IC that can quickly tune across the wide frequency range. At each frequency point, the signal is filtered, amplified, detected and its strength is measured by an analog-to-digital converter (ADC).
The digital signal data is then processed by a microcontroller that applies amplitude calibration factors, coordinates the frequency sweep, and transfers the data to the display and USB port. The microcontroller also handles user input from the buttons and exports various tracking generator signals.
Here is a simplified block diagram showing the key components in the RF Explorer:
graph LR
A[RF Input] --> B[Attenuator] --> C[Synthesizer] --> D[Mixer]
D --> E[IF Filter] --> F[Detector] --> G[ADC]
G --> H[Microcontroller] --> I[LCD Display]
H --> J[USB Port]
H --> K[Tracking Generator]
By sweeping quickly and having a high dynamic range, the RF Explorer is able to display a wide range of signal amplitudes and frequencies in near real-time. The fast response and handheld portability make it very useful for many RF applications that require quick analysis and troubleshooting.

Key Specifications and Performance
To better understand the capabilities of the RF Explorer, let’s review some of the key specifications and performance metrics. While exact specs vary slightly by model, here are typical values for the 3G Combo unit:
- Frequency Range: 15 MHz to 2.7 GHz
- Amplitude Range: -115 dBm to 0 dBm (with preamp and attenuator)
- Amplitude Accuracy: ±3 dB typical
- Displayed Average Noise Level (DANL): -105 dBm typical
- Resolution Bandwidth (RBW): 1.6 kHz minimum
- Dynamic Range: 70 dB typical
- Sweep Speed: 200 ms for 200 data points
- Tracking Generator Output: -10 dBm CW or ±2 MHz sweep
- Input Connector: SMA 50 ohm
- PC Connectivity: Mini USB
One of the most important factors for any spectrum analyzer is its ability to detect weak signals and distinguish them from noise. This is primarily determined by the DANL specification. With a typical DANL of -105 dBm, the RF Explorer has very good sensitivity for its price range.
The dynamic range spec of 70 dB means that the RF Explorer can simultaneously display signals with strengths varying by a factor of 10,000,000 to 1. This allows you to see strong and weak signals at the same time.
Having a fast sweep speed of 200 ms is very helpful to catch and display intermittent signals that may come and go quickly. Analyzers with slower scans would likely miss such brief events.
The built-in tracking generator is useful for testing filters, cables and antennas by providing a known test signal. It can output either a single CW frequency or sweep ±2 MHz around a center point.
While not a lab-grade instrument, the RF Explorer offers very good performance in a compact, low-cost package that is suitable for many real-world applications. With some creative thinking, it’s a powerful tool to have in your RF toolbox.

Applications and Uses
So what kind of things can you actually do with an RF Explorer? The possibilities are quite broad given its wide frequency range and portable form factor. Here are some common application areas:
Wireless Troubleshooting
One of the most popular uses is for troubleshooting wireless systems like Wi-Fi, Bluetooth, cordless phones, and walkie-talkies. By visualizing the RF spectrum, you can quickly identify issues like interference, noise, weak signals, and improper channel usage.
For example, if you are setting up a new Wi-Fi router, you can use the RF Explorer to scan the 2.4 GHz band and find the least congested channels to use. You can also spot any interfering signals from things like microwave ovens or wireless cameras.
Antenna Analysis
The RF Explorer is very handy for testing and optimizing antennas. You can use the tracking generator to sweep the antenna across its operating frequency range and view the relative signal strength. This lets you quickly characterize the antenna bandwidth, resonant frequency, and gain at different points.
You can also test an antenna’s directional pattern by placing the RF Explorer in CW signal source mode and monitoring the received signal strength as you rotate the antenna. Variations in signal level will reveal the antenna’s directionality.
Ham Radio
RF Explorer is a popular tool among amateur radio enthusiasts. It can be used to monitor band activity, track down sources of interference, and test equipment like filters and preamps. The 3G Combo model is especially useful as it covers many popular ham bands like 2 meters, 1.25 meters, and 70 cm.
With the RF Explorer connected to a PC, you can also use it as a panoramic adapter for software-defined radios (SDRs). This provides a real-time wideband spectrum display to complement the SDR’s tuning display.
Field Strength Measurements
Another application is making quick field strength measurements to assess RF transmitter coverage and propagation. By attaching the RF Explorer to a calibrated antenna and connecting it to a GPS, you can map out the signal strength contours in a given area.
This is useful for things like optimizing the location and power of wireless transmitters, estimating cell tower coverage, and verifying RF exposure compliance. While not as accurate as a professional signal survey, it provides a low-cost way to get quick field measurements.
EMC Pre-Compliance Testing
For engineers developing wireless products, the RF Explorer can be a useful pre-compliance tool for electromagnetic compatibility (EMC) testing. Before investing in expensive certified lab testing, you can use the RF Explorer to sniff for any unintentional radiators and check for spectral mask compliance.
This can help identify potential issues early and reduce the risk of failing the final EMC certification tests. It’s not a replacement for proper testing but rather a development aid to avoid costly late-stage redesigns.
As you can see, the RF Explorer opens up many applications thanks to its flexibility and performance. With some practice and creativity, it can be a valuable addition to any RF engineer or technician’s toolkit.

Operation and User Interface
Operating the RF Explorer is fairly straightforward thanks to its simple user interface. The front panel consists of a backlit LCD display, three soft keys, four navigation buttons, and two BNC connectors for RF input and tracking generator output.
The LCD display shows the spectrum trace along with key settings and measurements. Here is an example of a typical spectrum display:
+---------------+---------------------------------------------+
|               |                                             |
|               |                                             |
|               |            Spectrum Trace                   |
|               |                                             |
|               |                                             |
|               |                                         +---|
|               |                                         |   |
|               |                                         |   |
+---------------+---------------------------------------------+
| Freq:   Span: | -30 dBm Ref   Top:    Ampl Scale:  MaxHold |
| 2.400   0.050 | Atten: 0 dB   Pramp: OFF  RBW: 30k SwpTime |
| MHz     GHz   | Battery:██████████████     FW:v3.10   1.25s |
+---------------+---------------------------------------------+
|  Mkr1   Mkr2  |                   MKR                       |
+---------------+---------------------------------------------+
The soft keys below the display change function depending on the current mode and menu. They typically provide quick access to common settings like reference level, center frequency, RBW, and marker controls.
The four arrow buttons allow you to navigate menus and control the position of markers. The center button is used to select and activate different functions.
When first powered on, the RF Explorer will start in Spectrum Analyzer mode with the frequency span set to maximum. You can then use the soft keys and arrow buttons to adjust settings as needed for your particular application.
Some of the most common settings to adjust include:
- Center Frequency and Span – Sets the frequency range displayed on screen. Use a wide span for initial scanning, then narrow in on areas of interest.
- Reference Level – Sets the maximum signal level displayed. Adjust this so that your signals of interest fit on screen without clipping.
- RBW – Sets the resolution bandwidth which affects the ability to resolve signals close in frequency. Narrower RBW provides better resolution but slower sweep time.
- Attenuator and Preamp – The input attenuator is used to prevent overloading from strong signals. The preamp improves sensitivity to weak signals. Adjust depending on your signal environment.
- Markers – Used to measure absolute and relative signal levels at specific frequencies. The RF Explorer has four available markers with various counter, peak search and tracking modes.
- Traces – The RF Explorer can display up to three traces with normal, max hold, min hold and average trace modes.
By adjusting these parameters, you can optimize the RF Explorer to display and measure the signals you care about. As you gain more experience, you can dive deeper into some of the more advanced settings and measurement functions.
It’s worth spending some time with the user manual to learn the full capabilities of the RF Explorer. But with its intuitive interface, you can get up and running pretty quickly even if you are new to spectrum analyzers.
PC Software and Remote Control
In addition to the built-in user interface, you can also connect the RF Explorer to a PC via USB and control it using the free RF Explorer for Windows software. This provides additional capabilities like:
- Real-time remote control of all functions and settings
- Live spectrum streaming to the PC display
- Ability to save and recall setup configurations
- Logging and export of sweep data for analysis in other software
- Screen capture of plots for documentation
- Programming and automation using the RF Explorer API
Here is a screenshot showing the RF Explorer for Windows software controlling a device remotely:
+-------------------------------------------------------------------------+
|                          RF Explorer for Windows                        |
+-------------------------------------------------------------------------+
| +---------------------+  +---------------------------------------------+ |
| | Device Control      |  |                                             | |
| |                     |  |                                             | |
| | Port: COM3   ⚫ CONN |  |            Live Spectrum Plot              | |
| |                     |  |                                             | |
| | Freq: 2.400 GHz     |  |                                             | |
| | Span: 100.0 MHz     |  |                                             | |
| | Ampl: -30 dBm       |  |                                             | |
| | Mkr1: 2.412 GHz     |  |                                             | |
| |       -45.2 dBm     |  +---------------------------------------------+ |
| |                     |                                                  |
| | ⏻ MaxHold  ▶ Run    |  | Sweep:200  Atten:Auto  PreAmp:OFF  RBW:100kHz |
| |                     |  +--------------------------------------------------+
| +---------------------+  | Save Setup  Load Setup  Capture  Log  Config   |
+-------------------------------------------------------------------------+
Using the PC software is a great way to automate testing and capture data for further analysis. You can write scripts to control the RF Explorer and collect measurements over long periods of time.
The RF Explorer API uses a simple serial command protocol that you can integrate into your own custom software. Example code is available in languages like Python, C++, and MATLAB. This makes it possible to create automated test systems and interface with other equipment.
While the PC software adds a lot of capabilities, it’s not required to use the RF Explorer effectively. The built-in user interface is sufficient for many applications. But if you need more advanced functions, the USB connection and API provide a way to unlock the full potential of the device.
Tips and Tricks
Here are a few practical tips to help you get the most out of your RF Explorer:
- Use the right antenna – The stock telescoping whip antenna is OK for general scanning but consider upgrading to a better antenna for your frequency range of interest. A wideband log periodic can be a good all-purpose choice.
- Set the reference level carefully – To avoid distortion and overload, set the reference level about 10 dB above the highest expected signal. But don’t set it too high or you will lose sensitivity to weak signals.
- Select RBW appropriately – Narrower RBW is not always better as it increases sweep time. Start with wider RBW to scan quickly, then narrow down as needed to separate closely spaced signals.
- Utilize the attenuator and preamp – In high signal environments, engage the attenuator to prevent overload. In quiet environments looking for weak signals, use the preamp. Let the signal level guide your settings.
- Use max hold and average traces – Max hold is useful for capturing intermittent signals and viewing channel occupancy over time. Averaging reduces noise and improves repeatability for measuring signal levels.
- Apply correction factors – When measuring absolute signal levels, be sure to account for antenna factors, cable loss, and any external attenuators or amps. The RF Explorer PC software can apply these corrections.
- Use Limit Lines – You can define pass/fail limit lines in the PC software to quickly check for spectral mask compliance or identify signals exceeding a threshold.
- Get training – Consider getting formal RF training like amateur radio licensing or EMC seminars. Practical experience is great but some theory goes a long way in using the RF Explorer effectively.
By following these tips and exploring the features and settings of your RF Explorer, you can solve many real-world RF problems. Don’t be afraid to experiment and see what works best for your particular application.
Limitations and Drawbacks
While the RF Explorer is a very capable and flexible instrument, it does have some limitations to be aware of:
- Power Accuracy – Being a budget instrument, the RF Explorer has limited absolute power accuracy of around ±3 dB. It’s best suited for relative measurements unless you carefully calibrate it.
- Phase Noise – The RF Explorer’s internal oscillators have higher phase noise than lab-grade instruments. This can make it difficult to measure signals near the noise floor and can cause some distortion.
- RBW Shape Factor – The resolution bandwidth filters have a shape factor of ~10 which is higher than the 3-5 of most benchtop analyzers. This limits the ability to resolve closely spaced signals.
- Sweep Speed – While faster than most low-cost analyzers, the 200 ms minimum sweep time of the RF Explorer may be too slow to capture very brief pulsed or intermittent signals.
- Tracking Generator Limitations – The built-in tracking generator is relatively low power and has limited frequency offset range. An external generator may be needed for some component testing.
- No Advanced Triggering – The RF Explorer lacks some of the advanced trigger modes of higher-end analyzers which can make it tricky to capture complex signal events.
- EMC Compliance – Being a low-cost device, the RF Explorer has less shielding and filtering than lab-grade equipment. It may not fully meet strict EMC emissions or immunity requirements.
None of these limitations are show-stoppers but it’s important to understand them and set your expectations accordingly. The RF Explorer is
Leave a Reply